Rohini Knudson
SPED Professional Portfolio
Comprehensive Psychoeducational Assessment
 adaptive functioning |  sensory |
|---|---|
 language |  memory |
 motor |  attention |
 Bobby |  emotional |
 social |  executive |
 adaptive |  cognitive |
Cognitive Functioning
Adaptive Functioning
Social Functioning
Emotional Functioning
Academic Functioning
Sensory Functioning
Executive Functioning
Motor
Functioning
Attention
Memory
Language
How is Bobby doing?
A comprehensive neuropsychological evaluation involves the assessment of many areas of functioning, including overarching cognitive or intellectual ability, adaptive skills, attention, sensory processing, motor ability, language, executive functioning, visual–spatial and visual–motor ability, memory, academic skills, and social–emotional functioning (Ozonoff, 2018).
Neuropsychology
-
Branch of psychology that focuses on the relationship between the brain and behavior.
-
It seeks to discover how neurological processes such as memory, attention, language, perception, and executive functions (such as planning and decision-making) affect an individual's cognitive, emotional and behavioral functioning.
How is it utilized in the education of autistic children and youth?
-
Autistic children and youth often struggle to meet the social, behavioral and academic demands of a traditional school but each student may demonstrate a unique set of challenges, necessitating an in-depth analysis of each student's strengths and needs.
-
A comprehensive evaluation within a neuropsychological framework provides standardized measures of a student's functioning in each domain of life at home and school that can be compared to a normative group to detect a particular student's areas of relative strengths and weaknesses compared to the rest of the population.
-
This information can then be used to guide the design of customized support and instruction that leverages a student's strengths and targets their areas of need.
-
Further, the evaluation includes the assessment of both and individual's behaviors and neurological processes that underlie them. This might give educators an idea of why a student faces challenges in functioning and enable them to target the development of the underlying neurological processes themselves or to provide compensatory supports to make up for deficits in development.
Interpreting results of evaluation
When interpreting a student's scores from a comprehensive neuropsychological evaluation it helps to chart the various scores on a bell curve chart (shown in figure to the right). This bell curve is a graphical representation of a normal distribution and gives an idea of how likely it is for a random student in the population to attain a certain score on an assessment. Most standardized assessments are normalized with a mean of 100 and standard deviation of 15. A particular student's score can then be interpreted as follows:

Comparison of score with population scores
-
85-115: average range (within one standard deviation of the mean - about 68% of population)
-
116-130: above average range (between one and two standard deviations above the mean - about 14% of population)
-
70-84: below average range (between one and two standard deviations below the mean - about 14% of population)
-
> 130: significantly above average range (between one and two standard deviations above the mean - about 2% of population)
-
< 70: significantly below average range (between one and two standard deviations below the mean - about 2% of population)
Percentile Rank
While the bell curve lets us visualize what portion of population scored higher or lower than an individual student's score, an accurate percentile rank of a score can be obtained from the standard score using a psychometric conversion table (see adjacent figure).

Click on image above to see psychometric conversion table
An example
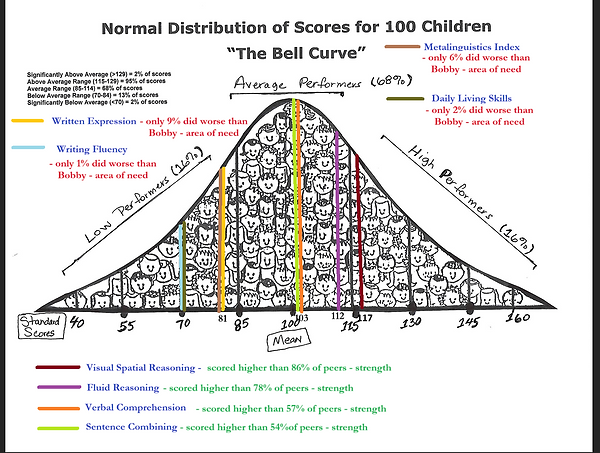
In the example above, the student's scores on different tests of comprehensive assessment are marked using different colored lines perpendicular to the score axis. A visual inspection and using the psychometric conversion table gives us the following information about the student's performance:
The student is expected to perform
-
above average on Visual Spatial Reasoning (standard score = 117, percentile rank = 87) - the student is expected to perform better than 86% (more than three-quarters) of the population.
-
at the high end of the average range on Fluid Reasoning (standard score = 112, percentile rank = 79) - the student is expected to perform better than 78% (more than three-quarters) of the population
-
in the middle of the average range on Verbal Comprehension (standard score = 103, percentile rank=58) - the student is expected to perform better than 57% (more than half) of the population
-
in the middle of the average range on Sentence Combining (standard score = 102, percentile rank = 55) - the student is expected to perform better than 54% (more than half) of the population
-
below average on Written Expression (standard score = 81, percentile rank = 10) - only 9% (less than a tenth) of the population is expected to perform worse than the student.
-
below average on Metalinguistics Index (standard score = 80, percentile rank = 7) - only 6% (less than a tenth) of the population is expected to perform worse than the student.
-
well below average on Writing Fluency (standard score = 70, percentile rank = 2) - only 1% (one in every hundred) of the population is expected to perform worse than the student.
-
well below average on Daily Living Skills (standard score = 71, percentile rank = 3) - only 2% (2 in every hundred) of the population is expected to perform worse than the student.
Applying the results of evaluation to guide instructional goals and methods
A comparison of the student's scores with the rest of the population helps educators identify the student's strengths and areas of need. Instruction and the educational environment can then be customized to:
-
leverage student strengths
-
develop areas of need
-
provide supports to compensate for deficits in development
Once instructional goals have been identified, educators can use one of several methods that have been proven to be effective in addressing specific areas of need in autistic students.
The example - continued
In the example above, the comparison of the student's scores with the normative group might lead to identifying the following as the student's strengths and areas of need:
Strengths
-
visual spatial reasoning - the ability to discern patterns in visually presented data and synthesize patterns in multi-dimensional space
-
fluid reasoning - the ability to generalize observed patterns and derive logical conclusions from such generalized principles
-
verbal comprehension - the ability to recognize and understand words and to use words to express ideas
-
sentence combining - the ability to combine sentences using correct grammar, punctuation and spelling
Areas of Need
-
written expression - the ability to express ideas in writing
-
writing fluency - the ability to write quickly in response to a prompt
-
metalinguistics index - a measure of the ability to make inferences, understand lexical and structural ambiguities in language, and understand figurative language
-
daily living skills - the performance of personal, domestic and community living tasks typically expected of children at home and school
The needs listed above may manifest as academic failure, non-compliance or other disruptive behaviors. The comprehensive evaluation gives parents and educators deeper insights into why these behaviors occur.
Caregivers can then find ways to leverage the student's strengths to help them develop their areas of relative weakness. In the example, the following techniques might be used that harness the student's strengths:
Leveraging student strengths
-
The student's relative strength in sentence combining can be harnessed to improve their general writing ability through modeling and practice - a caregiver can collaborate on writing a story with him where they both contribute ideas freely and the student can combine and write down the sentences generated.
-
The student's strength in fluid reasoning can be leveraged to improve their metalinguistic skills - giving the student time to process numerous samples of indirect and figurative speech in various simulated and real contexts and patiently answering their questions regarding the validity of meanings that people generally attribute to each ambiguous utterance is likely to give the student enough data that they can then generalize and apply in their daily interactions with people and in academics.
Educators can also rely on techniques that have been proven to address areas of need in autistic students effectively. In the example, the following evidence-based practices might help the student with their areas of need:
Using EBPs (evidence-based practices) to address areas of need
-
TAII (Technology Aided Instruction and Intervention) (Hedges & AFIRM Team, 2017) might be beneficial to this student. Specifically, they could be allowed to type their written assignments on a computer using a text editor such as Microsoft Word. Such software comes with spelling assistance which might help the student correct their mistakes more easily and learn how to spell words more accurately. This will address the student's weakness in writing fluency and make the process more efficient given the student time to focus on the content of the writing task.
-
Visual supports (Sam & AFIRM Team, 2015) such as task lists, schedules and reminders can assist the student in attending to the tasks involved in daily living. The predictability of schedules and assistance of visual cues will allow the student to accomplish these tasks efficiently, with minimal disruption to his desired activities and minimal cognitive investment.
-
Self-management (Sam & AFIRM Team, 2016) strategies can also be introduced to the student to help him keep track of his performance of tasks related to personal care and community demands.